

🔑 Key Points of This News
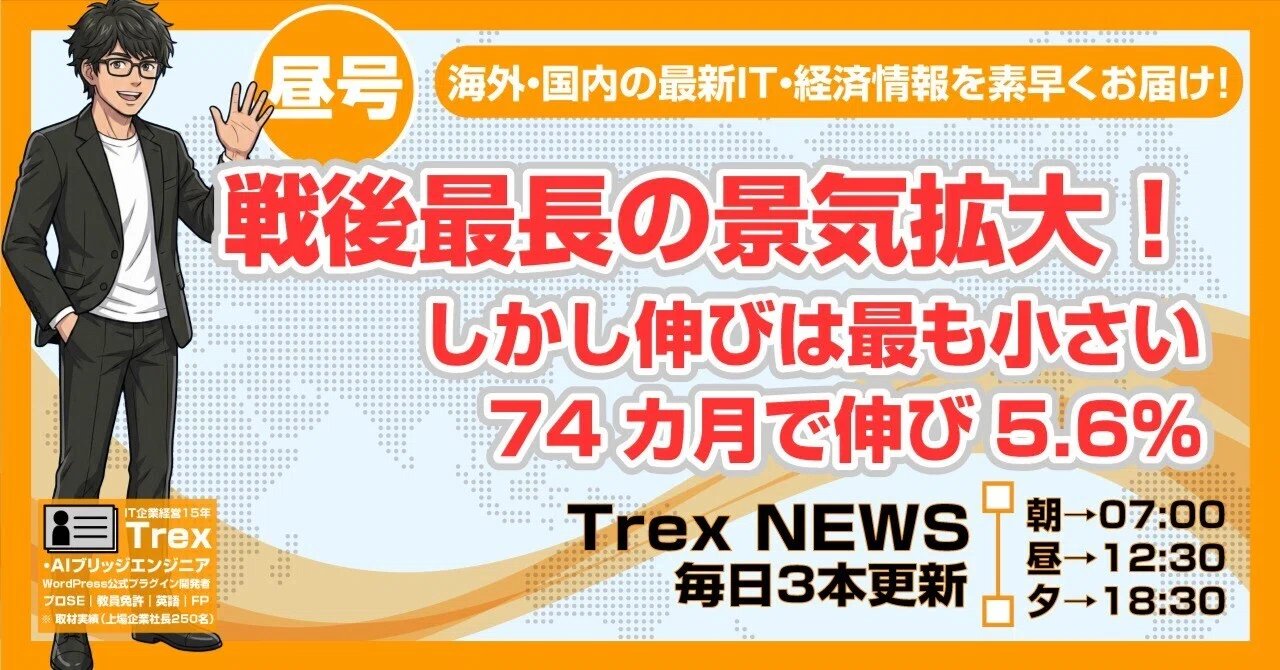
The economic expansion reached 74 months as of this July, likely surpassing the 73-month ‘Izanami Boom’ to become the longest in the post-war era. However, according to Daiwa Institute of Research’s estimates on September 17, the increase in real GDP measured from before the COVID-19 pandemic is only 5.6%. This is about half of the 10.1% seen during the Izanami Boom. We examine the details of this record by separating duration from strength.
🎯 The Main Point
The ‘longest post-war’ record refers to the number of months the economy has continued to expand, not a record of how much the economy has grown.
— PR —
📌 The 74-month post-war record is a record of duration, and the 5.6% growth in real GDP measured from before the COVID-19 pandemic is only about half that of the Izanami Boom.
📅 Where did the 74-month figure come from?
The boundary between economic ‘expansion’ and ‘contraction’ is determined by the Economic and Social Research Institute of the Cabinet Office as the business cycle reference date. The month when the economy hits bottom is called the trough, and the month it peaks is called the peak; the period from trough to peak is the expansion phase.
The most recently confirmed trough is May 2020. This was the month when economic activity plummeted due to the COVID-19 pandemic. Expansion began the following month, and if it has continued uninterrupted until this July, it totals 74 months.
The previous record was 73 months for the 14th cycle, which lasted from the trough in January 2002 to the peak in February 2008. This is generally known as the ‘Izanami Boom.’ This time, the calculation exceeds that record by one month.
However, the current 74-month figure is merely a provisional count based on the fact that the trend judgment of the business conditions index remains ‘improving.’ It took two years for the previous peak to be confirmed after it was provisionally set. The duration record itself leaves room for later revision.
📏 Duration and growth are different things. The 5.6% yardstick
The duration of an economic expansion counts ‘how many months the economy has not worsened.’ Nothing can be known about how much the economy has grown during that time from the duration alone.
Daiwa Institute of Research compared long expansion periods using real GDP, which is the scale of the economy excluding the effects of price changes. The Izanami Boom saw a 10.1% increase during its expansion period, and the previous expansion starting in 2012 saw an 8.6% increase.
Measuring this time from the October-December quarter of 2019 to the April-June quarter of this year, the increase is only 5.6%. On an annual average, this is 0.8%, falling below 1%. Although the number of months is the longest of the three, the growth is the smallest.
The Izanagi Boom during the high-growth period grew by 67.8% over 57 months, and the Bubble Economy grew by 24.4% over 51 months. While this current expansion has lasted much longer than those, the size of the economy has hardly changed. It is rare for an expansion period to have such a discrepancy between duration and strength.
⚖️ Changing the starting point changes the ranking
What we should note here is that the conclusion reverses depending on where you start measuring. If you use the official trough of the April-June quarter of 2020 as the starting point, the growth rate for this period jumps to 13.4%, exceeding the 10.1% of the Izanami Boom.
The reason lies in the low starting point. Real GDP in the April-June quarter of 2020 recorded an unprecedented drop of 26% at an annualized rate compared to the previous quarter. If you measure from the bottom of a deep hole, it looks like it has grown significantly just by returning to its original height.
This is why the Daiwa Institute of Research chose to reset the starting point to the October-December quarter of 2019, before the COVID-19 pandemic. Excluding the portion that fell into the hole and climbed back out, the net remaining growth is 5.6%.
There are also private sector estimates measured from different starting points. Mitsubishi UFJ Research and Consulting estimated an average annual growth of 1.3% starting from the October-December quarter of 2020, excluding the July-September quarter of 2020, which saw significant growth due to the rebound. This level is not much different from the 1.6% of the Izanami boom or the 1.4% of the previous economic cycle.
No matter which starting point is chosen, the growth does not clearly exceed past long expansion periods. When looking at economic records, one should always check in tandem how many months it lasted and from where it grew by what percentage.
💹 The view looks completely different in nominal terms
Still, there is a reason why the sentiment that the economy is good persists. When viewed in nominal GDP, which does not exclude the effects of inflation, the landscape changes completely.
Nominal GDP reached an annualized 689 trillion yen in the April-June quarter of this year, expanding significantly from 528 trillion yen in the April-June quarter of 2020. With an increase of over 30%, the economy appears to have expanded rapidly in terms of figures.
Corporate profits are the same. According to the Financial Statements Statistics of Corporations by Industry, ordinary profits for the April-June quarter hit a record high for the seventh consecutive quarter of growth. Overseas earnings have swelled when converted to yen due to the weak yen, and sales have also been boosted by price hikes.
Much of the nominal expansion is the result of rising prices rather than an increase in volume. Corporate financial statements and stock prices move in nominal terms, while household life moves in real terms. The gap between these two yardsticks is close to the essence of the discomfort that it is the longest expansion but feels like nothing.
🌍 The weakness becomes clear when compared with overseas
The same picture emerges in international comparisons. Real GDP for the April-June quarter of 2026 compared to the 2019 average shows Japan at plus 3.4%, remaining only 6th among the G7 nations.
The United States, which saw the most growth, was at plus 17.2%, with its economy growing at about five times the pace of Japan’s. While living through the same period, Japan, which set a record for the ‘length’ of its economic expansion, is second from the bottom in ‘growth’.
The only country below Japan is Germany at plus 1.8%. Canada grew by 12.6%, Italy by 7.3%, the UK by 6.6%, and France by 6.0%. Even compared to major European countries, Japan’s growth is lackluster.
The difference is significant in personal consumption. The contribution of personal consumption to Japan’s real GDP growth was only plus 0.4 percentage points compared to the 2019 average. The power of households to spend money and push the economy forward is barely working.
💴 Household take-home pay has not reached 2019 levels
The reason personal consumption is not growing lies in real take-home pay. According to Daiwa Institute of Research’s estimates, household real disposable income in the April-June quarter of 2026 was slightly below the 2019 average.
Breaking down the contents reveals the composition. Nominal wages per person pushed up by 13.0 points compared to 2019, and an increase in the proportion of working people also pushed up by 6.0 points. These are the bright spots so far.
However, rising prices pushed down by 16.4 points, and population decline pushed down by 3.0 points. It is calculated that price increases have almost entirely eaten up what was earned through wage hikes and labor participation.
On the supply side, the weakness of the manufacturing sector is notable. Real GDP for the manufacturing sector has been on a downward trend since peaking in the July-September quarter of 2022, with the non-manufacturing sector providing support. Even if the economy continues, production at domestic factories is becoming difficult to increase.
🔭 Lasting a long time is not proof of strength
Why does it last a long time even though it is weak? Takahide Kiuchi of the Nomura Research Institute points out that the economic cycle itself has become smaller, making it harder to enter a recessionary phase unless there is a major external shock.
If the waves are small, neither the peaks nor the troughs are distinct. Even with low growth, as long as things do not deteriorate, the expansion phase continues. The record-breaking streak reflects the fact that fluctuations have become smaller rather than the strength of the Japanese economy.
The Bank of Japan raised its policy interest rate to 1.25% on September 18. While prices and wages have begun to circulate, real growth remains thin. The gap between the record length and the reality of its strength weighs heavily on households and companies in this era of interest rates.
🔍 Trex’s Perspective
The term “longest post-war” inevitably makes one imagine a strong economy. However, when you break down the numbers, the record indicates the length in months, not the growth in the size of the economy. Not conflating these two is the first step in reading headlines.
From the perspective of someone who handles data, what concerns me most is that the ranking changes depending on how you choose the starting point. If you start from a deep slump, any expansion phase looks impressive. The difference between 13.4% and 5.6% is a prime example of how the presentation of statistics dictates the conclusion.
Even from my 15 years of experience in IT company management, the number of years without a deficit and the degree to which a company has grown were two different things. It is important to last a long time without going under, but that alone does not raise employees’ salaries. The current Japanese economy is in a state very close to that.
Admittedly, the shift from deflation to an economy where wages and prices move is a definite achievement of this expansion phase. The problem is that wage increases are not keeping up with price hikes. For households, the day when real take-home pay exceeds 2019 levels will be a much more meaningful milestone than the length of the record.
Also, it will be years before it is decided when this expansion phase actually ended. All current discussions are based on provisional figures. Whether celebrating or lamenting the record, it is worth keeping in the back of one’s mind that the premises are still subject to change.
💡 Today’s Action
-
Look for the growth rate when you see a “longest” headline: When economic records are reported, check not only how many months it lasted, but also by what percentage real GDP increased during that time. Get into the habit of looking at length and growth as a pair.
-
Confirm the starting point: When you encounter growth rate figures, look at when they are measured from. Depending on whether you measure from the bottom of the COVID-19 crisis or from before it, this time it splits into 13.4% and 5.6%.
-
Compare your own household finances with 2019: List your take-home pay and the prices of items you frequently buy alongside those from around 2019. This will be material to verify if the statistic that “real take-home pay is on par with 2019” matches your own experience.
— PR —
🔗 Reference Links
📚 Recommended Sites
・Kashika-pedia | A media outlet that explains the structure of data and news in an easy-to-understand visual format.
・Machi-pedia | A data encyclopedia of Japan’s municipalities.
